Sustainable Accurate Fair and Explainable Machine Learning Models: Difference between revisions
No edit summary |
No edit summary |
||
| Line 33: | Line 33: | ||
== Introduction == | == Introduction == | ||
Data driven Artificial Intelligence (AI), boosted by the availability of Machine Learning (ML) models, is rapidly expanding and changing financial services. ML models typically achieve a high accuracy, at the expense of an insufficient explainability<ref>N. Bussmann, P. Giudici, D. Marinelli, J. Papenbrock, [https://www.doi.org/10.1007/s10614-020-10042-0 Explainable Machine Learning in Credit Risk Management]. ''Comput. Econ''. 57, 203–216 (2020) doi: 10.1007/s10614-020-10042-0</ref><ref>P. Bracke, A. Datta, C. Jung, S. Shayak, [https://www.bankofengland.co.uk/working-paper/2019/machine-learning-explainability-in-finance-an-application-to-default-risk-analysis Machine learning explainability in finance: an application to default risk analysis (2019) | Data driven Artificial Intelligence (AI), boosted by the availability of Machine Learning (ML) models, is rapidly expanding and changing financial services. ML models typically achieve a high accuracy, at the expense of an insufficient explainability<ref>N. Bussmann, P. Giudici, D. Marinelli, J. Papenbrock, [https://www.doi.org/10.1007/s10614-020-10042-0 Explainable Machine Learning in Credit Risk Management]. ''Comput. Econ''. 57, 203–216 (2020) doi: 10.1007/s10614-020-10042-0</ref><ref>P. Bracke, A. Datta, C. Jung, S. Shayak, [https://www.bankofengland.co.uk/working-paper/2019/machine-learning-explainability-in-finance-an-application-to-default-risk-analysis Machine learning explainability in finance: an application to default risk analysis]. (2019)</ref>. Moreover, according to the proposed regulations, high-risk AI applications based on machine learning must be “trustworthy”, and comply with a set of further requirements, such as Sustainability and Fairness. | ||
To date there are no standardised metrics that can ensure an overall assessment of the trustworthiness of AI applications in finance. To fill the gap, we propose a set of integrated statistical methods, based on the Lorenz Zonoid, the multidimensional extension of the Gini coefficient, that can be used to assess and monitor over time whether an AI application is trustworthy. Specifically, the methods will measure Sustainability (in terms of robustness with respect to anomalous data), Accuracy (in terms of predictive accuracy), Fairness (in terms of prediction bias across different population groups) and explainability (in terms of human understanding and oversight). We apply our proposal to an openly downloadable dataset, that concerns financial prices, to make our proposal easily reproducible. | To date there are no standardised metrics that can ensure an overall assessment of the trustworthiness of AI applications in finance. To fill the gap, we propose a set of integrated statistical methods, based on the Lorenz Zonoid, the multidimensional extension of the Gini coefficient, that can be used to assess and monitor over time whether an AI application is trustworthy. Specifically, the methods will measure Sustainability (in terms of robustness with respect to anomalous data), Accuracy (in terms of predictive accuracy), Fairness (in terms of prediction bias across different population groups) and explainability (in terms of human understanding and oversight). We apply our proposal to an openly downloadable dataset, that concerns financial prices, to make our proposal easily reproducible. | ||
Latest revision as of 10:26, 18 April 2023
Paolo Giudici(a) and Emanuela Raffinetti(b)
(a) Department of Economics and Management, University of Pavia, Via San Felice al Monastero, 27100 Pavia, Italy; paolo.giudici@unipv.it
(b) Department of Economics and Management, University of Pavia, Via San Felice al Monastero, 27100 Pavia, Italy; emanuela.raffinetti@unipv.it
| Published |
| April 11, 2023 |
| Title |
| Sustainable, Accurate, Fair and Explainable Machine Learning Models |
| Authors |
| Paolo Giudici(a) and Emanuela Raffinetti(b) |
| Downloads |
Abstract
Machine learning models are currently favouring Artificial Intelligence applications in several fields, such as for instance, in finance. Through the employment of machine learning models, high predictive accuracy is achieved but at the expense of interpretability. The loss of explainability represents a crucial issue, especially in regulated industries, as authorities may not validate Artificial Intelligence methods if they are unable to monitor and limit the risks deriving from them. For this reason and according to the proposed regulations, high-risk Artificial Intelligence applications based on machine learning must be “trustworthy” and fulfill a set of basic requirements. In this paper, we propose a methodology based on Lorenz Zonoids to assess whether a machine learning model is S.A.F.E.: Sustainable, Accurate, Fair and Explainable.
Introduction
Data driven Artificial Intelligence (AI), boosted by the availability of Machine Learning (ML) models, is rapidly expanding and changing financial services. ML models typically achieve a high accuracy, at the expense of an insufficient explainability[1][2]. Moreover, according to the proposed regulations, high-risk AI applications based on machine learning must be “trustworthy”, and comply with a set of further requirements, such as Sustainability and Fairness.
To date there are no standardised metrics that can ensure an overall assessment of the trustworthiness of AI applications in finance. To fill the gap, we propose a set of integrated statistical methods, based on the Lorenz Zonoid, the multidimensional extension of the Gini coefficient, that can be used to assess and monitor over time whether an AI application is trustworthy. Specifically, the methods will measure Sustainability (in terms of robustness with respect to anomalous data), Accuracy (in terms of predictive accuracy), Fairness (in terms of prediction bias across different population groups) and explainability (in terms of human understanding and oversight). We apply our proposal to an openly downloadable dataset, that concerns financial prices, to make our proposal easily reproducible.
Methodology
Lorenz Zonoids were originally proposed by[3] as a generalisation of the Lorenz curve in a multidimensional setting. When referred to the one-dimensional case, the Lorenz Zonoid coincides with the Gini coefficient, a measure typically used for representing the income inequality or the wealth inequality
within a nation or a social group[4][5]. Both the Gini coefficient and the Lorenz Zonoid measure statistical dispersion in terms of the mutual variability among the observations, a metric that is more robust to extreme data than the standard variability from the mean.
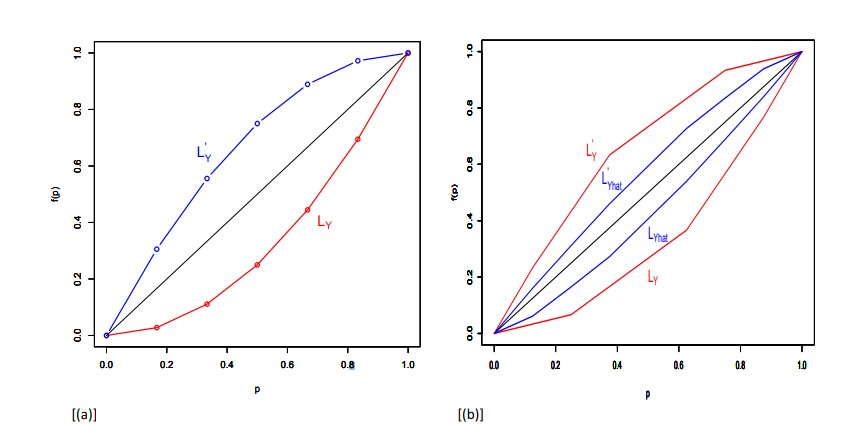
Given a variable [math]\displaystyle{ Y }[/math] and [math]\displaystyle{ n }[/math] observations, the Lorenz Zonoid can be defined from the Lorenz ([math]\displaystyle{ L_Y }[/math]) and the dual Lorenz curves ([math]\displaystyle{ L'_Y }[/math])[5], whose graphical representations are provided in Fig. 1 [a].
The Lorenz curve for a variable [math]\displaystyle{ Y (L_Y) }[/math], obtained by re-ordering the [math]\displaystyle{ Y }[/math] values in non-decreasing sense, has points whose coordinates can be specified as [math]\displaystyle{ (i/n, \sum_{j=1}^i yr_j/(n\bar{y})) }[/math], for [math]\displaystyle{ i = 1, . . . , n }[/math], where [math]\displaystyle{ r }[/math] and [math]\displaystyle{ /bar{y} }[/math] indicate the (non-decreasing) ranks of [math]\displaystyle{ Y }[/math] and the [math]\displaystyle{ Y }[/math] mean value, respectively. Similarly, the dual Lorenz curve of [math]\displaystyle{ Y (L'_Y) }[/math], obtained by re-ordering the [math]\displaystyle{ Y }[/math] values in a non-increasing sense, has points with coordinates [math]\displaystyle{ (i/n, \sum_{j=1}^i yd_j/(n\bar{y})) }[/math], for [math]\displaystyle{ i = 1, . . . , n }[/math], where [math]\displaystyle{ d }[/math] indicates the (non-increasing) ranks of [math]\displaystyle{ Y }[/math]. The area lying between the [math]\displaystyle{ L_Y }[/math] and [math]\displaystyle{ L'_Y }[/math] curves corresponds to the Lorenz Zonoid, which coincides with the Gini coefficient in the one dimensional case.
From a practical view point, given n observations, the Lorenz Zonoid of a generic variable · is computed through the covariance operator as
| [math]\displaystyle{ LZ(·) = \frac{2Cov(·, r(·))}{nE(·)} }[/math] | (1) |
where [math]\displaystyle{ r(·) }[/math] and [math]\displaystyle{ E(·) }[/math] are the corresponding rank score and mean value, respectively.
The Lorenz Zonoid fulfills some attractive properties. An important one is the “inclusion” of the Lorenz Zonoid of any set of predicted values [math]\displaystyle{ \hat{Y} (LZ(\hat{Y})) }[/math] into the Lorenz Zonoid of the observed response variable [math]\displaystyle{ Y (LZ(Y)) }[/math]. The “inclusion property”, whose graphical representation is displayed in Fig. 1 [b], allows to interpret the ratio between the Lorenz Zonoid of a particular predictor set [math]\displaystyle{ \hat{Y} }[/math] and the Lorenz Zonoid of Y as the mutual variability of the response “explained” by the predictor variables that give rise to [math]\displaystyle{ \hat{Y} }[/math], similarly to what occurs in the well known variance decomposition that gives rise to the [math]\displaystyle{ R^2 }[/math] measure.
In this paper, we leverage the inclusion property to derive a machine learning feature selection method that, while maintaining a high predictive accuracy, increases explainability via parsimony and can also improve both sustainability and fairness. More precisely, we present novel scores for assessing both explainability and accuracy.
Given [math]\displaystyle{ K }[/math] predictors, a score for evaluating explainability can be defined as:
| [math]\displaystyle{ Ex }[/math]-[math]\displaystyle{ Score = \frac{\sum_{k=1}^K SL_K}{LZ(Y)} }[/math] | (2) |
where [math]\displaystyle{ LZ(Y) }[/math] corresponds to the response variable [math]\displaystyle{ Y }[/math] Lorenz Zonoid-value, and [math]\displaystyle{ SL_k }[/math] denotes the Shapley-Lorenz values associated with the [math]\displaystyle{ k }[/math]-th predictor. It is worth noting that, as illustrated in[6], the Shapley-Lorenz contribution associated with the additional included variable [math]\displaystyle{ X_k }[/math] equals to:
| [math]\displaystyle{ LZ^{X_k} (\hat{Y}) = \sum_{X'⊆C(X)/X_k} \frac{|X'|!(K − |X'| − 1)!}{K!}[LZ(\hat{Y}_{X'∪X_k}) - LZ(\hat{Y}_{X'})] }[/math] | (3) |
where [math]\displaystyle{ LZ(\hat{Y}_{X'∪X_k}) }[/math] and [math]\displaystyle{ LZ(\hat{Y}_X') }[/math] describe the (mutual) variability of the response variable [math]\displaystyle{ Y }[/math] explained by the models which, respectively, include the [math]\displaystyle{ X'∪X_k }[/math] predictors and only the [math]\displaystyle{ X' }[/math]predictors.
In a similar way, and following a cross-validation procedure consisting in splitting the whole dataset into a train and a test set, the accuracy of the predictions generated by a ML model can be derived as:
| [math]\displaystyle{ Ac }[/math]-[math]\displaystyle{ Score = \frac{LZ(\hat{Y}_{X_1,...,X_k})}{LZ(Y_{test})} }[/math] | (4) |
where [math]\displaystyle{ LZ(\hat{Y}_{X_1,...,X_k}) }[/math] is the Lorenz Zonoid of the predicted response variable, obtained using [math]\displaystyle{ k }[/math] predictors on the test set, and [math]\displaystyle{ LZ(Y_{test}) }[/math] is the Y response variable Lorenz Zonoid value computed on the same test set.
By exploiting the Shapley-Lorenz values and the set of the predictors which allow to ensure a suitable degree of predictive accuracy, appropriate scores for measuring both fairness and sustainability can be formalised.
Data
The considered data are described in[7] and are aimed to understand whether and how bitcoin price returns vary as a function of a set of classical financial explanatory variables.
A further investigation of the data was carried out in a work by[6], who introduced a normalised Shapley measure for the assessment of the contribution of each additional predictor, in terms of Lorenz Zonoids.
The data include a time series of daily bitcoin price returns in the Coinbase exchange, as the target variable to be predicted, and the time series of the Oil, Gold and SP500 return prices, along with those of the exchange rates USD/Yuan and USD/Eur, as candidate explanatory variables.
The aim of the data analysis is to employ the proposed S.A.F.E. metrics derived from the Lorenz Zonoid tool as criteria for measuring the SAFEty of a collection of machine learning models, based on the application of neural networks.
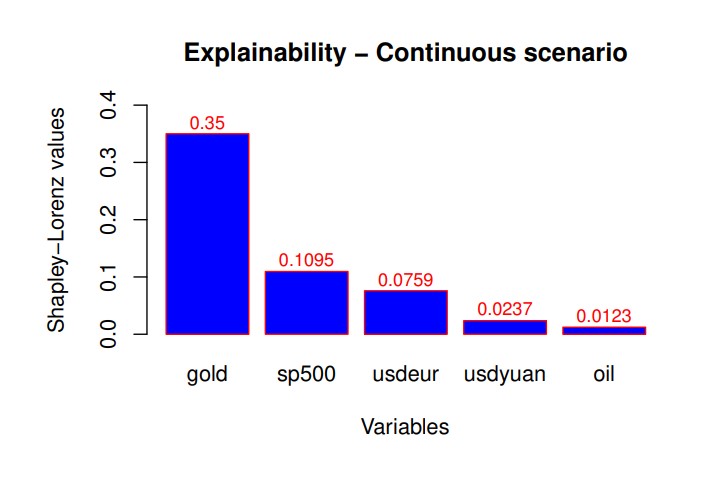
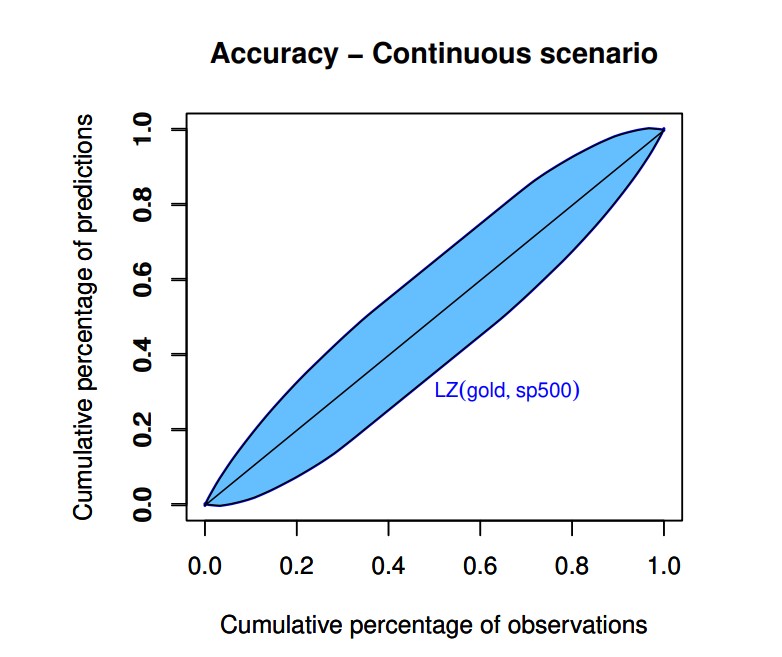
For lack of space, we present only the results that concern explainability, in Fig. 2; and accuracy, in Fig. 3. Both are calculated on the predictions obtained from the application of a neural network model to the data.
Fig. 2 shows the Shapley-Lorenz measure of explainability[6], which is a normalised extension of the classic Shapley values, for all considered explanatory variables of the daily bitcoin price returns. Fig. 2 clearly highlights that the price returns of Gold is the most important variable that explains bitcoin price return variations, followed by the others.
Fig. 3 shows the Lorenz Zonoid of the machine learning model selected by our proposed feature selection procedure, based on the comparison between Lorenz Zonoids.
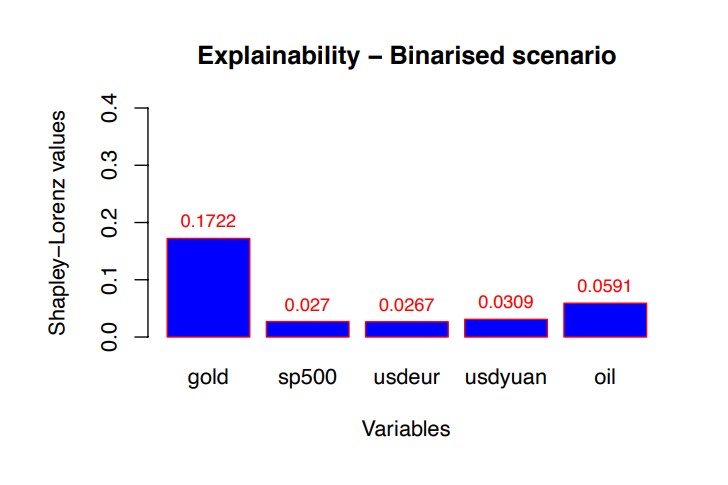
Note that the model selected in Fig. 3 contains Gold and SP500 as the relevant predictors. For robustness, we have repeated the analysis binarising the response variable around the zero value. The advantage of our proposed methodology is that no changes of metrics is equested to repeat the assessment of trustworthy AI, although the nature of the response variable has changed. For lack of space, we present only the results in terms of explainability, in Fig. 4.
From Fig. 4 note that Gold price returns is confirmed as the most important variable, but the second important variable is the Oil price, rather than SP500.
Conclusions
In the paper we propose a set of statistical measures that can ensure an overall assessment of the trustworthiness of AI applications. The application of the proposed scores to a neural network model, used to predict bitcoin price returns in terms of a set of classical financial variables, shows the practical utility of our approach.
References
- ↑ N. Bussmann, P. Giudici, D. Marinelli, J. Papenbrock, Explainable Machine Learning in Credit Risk Management. Comput. Econ. 57, 203–216 (2020) doi: 10.1007/s10614-020-10042-0
- ↑ P. Bracke, A. Datta, C. Jung, S. Shayak, Machine learning explainability in finance: an application to default risk analysis. (2019)
- ↑ G. Koshevoy, K. Mosler, The Lorenz Zonoid of a Multivariate Distribution. J. Am. Stat. Assoc. 91, 873–882 (1996). doi: 10.2307/2291682
- ↑ C. Gini, On the measure of concentration with special reference to income and statistics. General Series 208, pp. 73-79. Colorado College Publication (1936)
- ↑ 5.0 5.1 M.O. Lorenz, Methods of measuring the concentration of wealth. Publications of the American Statistical Association 70, 209-219 (1905) doi:10.2307/2276207
- ↑ 6.0 6.1 6.2 P. Giudici, E. Raffinetti, Shapley-Lorenz eXplainable Artificial Intelligence. Expert Syst. Appl. 167, 1–9 (2021) doi: 10.1016/j.eswa.2020.114104
- ↑ P. Giudici, I. Abu-Hashish, What determines bitcoin exchange prices? A network var approach. Financ. Res. Lett. 28, 309–318 (2019). doi: 10.1016/j.frl.2018.05.013]


